Sunday 8 March 2020

INSTRUCTIONAL TOOL: EXCEL FOR NURSES


Introduction to Microsoft Excel

What is Excel?
Excel is a software program from Microsoft that is part of the Microsoft Office suite of productivity software developed by Microsoft. It is one of the most used software applications of all time. Hundreds of millions of people around the world use Microsoft Excel. You can use Excel to enter all sorts of data and perform financial, mathematical or statistical calculations.

History

From its first version Excel supported end user programming of macros (automation of repetitive tasks) and user defined functions (extension of Excel's built-in function library). In early versions of Excel these programs were written in a macro language whose statements had formula syntax and resided in the cells of special purpose macro sheets (stored with file extension .XLM in Windows.) XLM was the default macro language for Excel through Excel 4.0.[26] Beginning with version 5.0 Excel recorded macros in VBA by default but with version 5.0 XLM recording was still allowed as an option. After version 5.0 that option was discontinued. All versions of Excel, including Excel 2010 are capable of running an XLM macro, though Microsoft discourages their use.

When did Excel first come out?

Microsoft released the first version of Excel for the Macintosh on September 30, 1985, and the first Windows version was 2.05 (to synchronize with the Macintosh version 2.2) in November 1987.

Who invented Excel?

Dan Bricklin

The computer spreadsheet was invented by Dan Bricklin in 1978–79. It was originally supported on AppleII, under the program name VisiCalc.

Dan Bricklin often referred to as "the father of Spreadsheet" is the American co-creator, with Bob Frankston, of the VisiCalc spreadsheet program. He also founded Software Garden, Inc., of which he is currently president, and Trellix Corporation. He currently serves as the chief technology officer of Alpha Software.


MICROSOFT EXCEL

There are numbers of spreadsheet programs but from all of them, Excel is most widely used. People have been using it for last 30 years and throughout these years, it has been upgraded with more and more features.
The best part about Excel is, it can apply to many business tasks, including statistics, finance, data management, forecasting, analysis, inventory, billing, and business intelligence.

Following are the few things which it can do for you:
  • Number Crunching
  • Charts and Graphs
  • Store and Import Data
  • Manipulating Text
  • Templates/Dashboards
  • Automation of Tasks
  • And Much More...
Three most important components of Excel is which you need to understand first:
  1. Cell: A cell is a smallest but most powerful part of a spreadsheet. You can enter your data into a cell either by typing or by copy-paste. Data can be a text, a number, or a date. You can also customize it by changing its size, font color, background color, borders, etc. Every cell is identified by its cell address, cell address contains its column number and row number (If a cell is on 11th row and on column AB, then its address will be AB11).
  2. Worksheet: A worksheet is made up of individual cells which can contain a value, a formula, or text. It also has an invisible draw layer, which holds charts, images, and diagrams. Each worksheet in a workbook is accessible by clicking the tab at the bottom of the workbook window. In addition, a workbook can store chart sheets; a chart sheet displays a single chart and is accessible by clicking a tab.
  3. Workbook: A workbook is a separate file just like every other application has. Each workbook contains one or more worksheets. You can also say that a workbook is a collection of multiple worksheets or can be a single worksheet. You can add or delete worksheets, hide them within the workbook without deleting them, and change the order of your worksheets within the workbook.

Microsoft Excel Window Components

Before you start using it, it’s really important to understand that what’s where in its window. So ahead we have all the major component which you need to know before entering the world of Microsoft Excel.


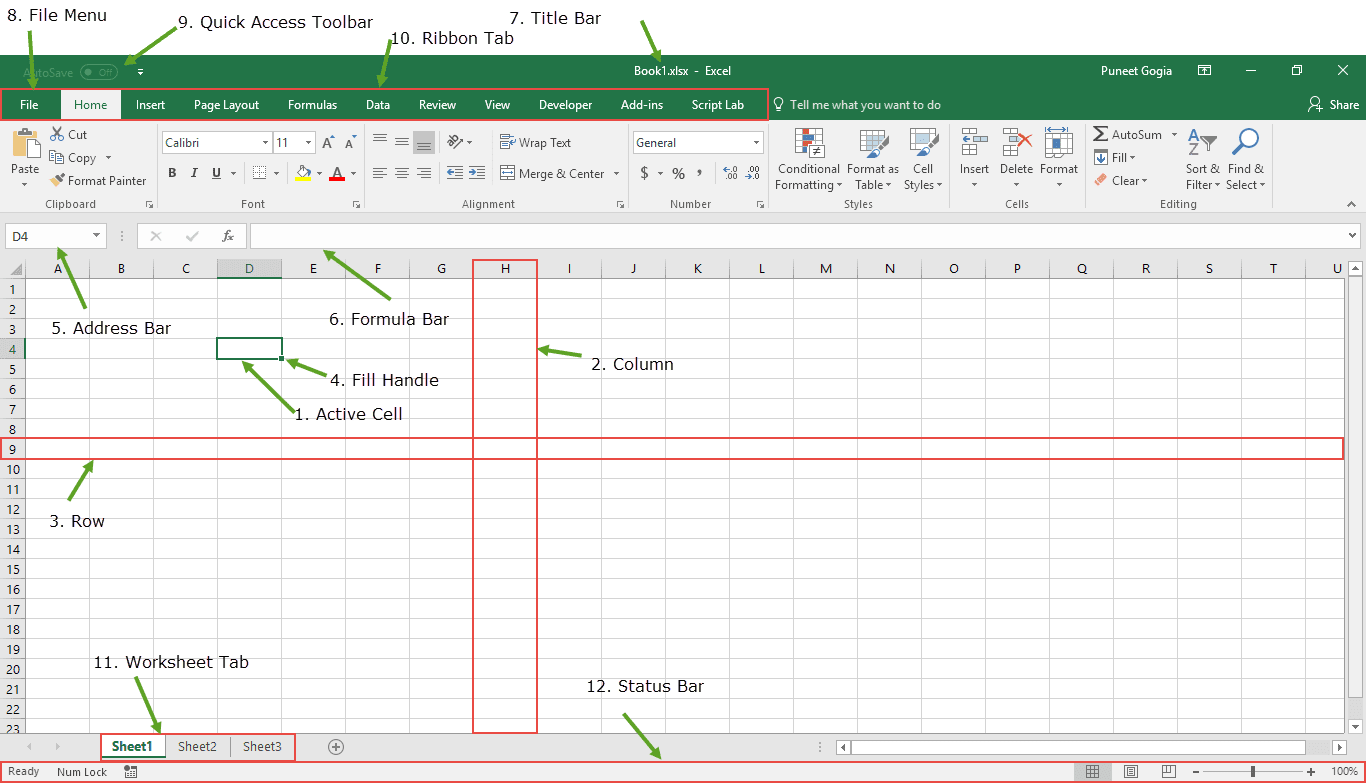
1. Active Cell: A cell which is currently selected. It will be highlighted by a rectangular box and its address will be shown in the address bar. You can activate a cell by clicking on it or by using your arrow buttons. To edit a cell, you double-click on it or use F2 to as well.
2. Columns: A column is a vertical set of cells. A single worksheet contains 16384 total columns. Every column has its own alphabet for identity, from A to XFD. You can select a column clicking on its header.
3. Rows: A row is a horizontal set of cells. A single worksheet contains 1048576 total rows. Every row has its own number for identity, starting from 1 to 1048576. You can select a row clicking on the row number marked on the left side of the window.
4.Fill Handle: It’s a small dot present on the lower right corner of the active cell. It helps you to fill numeric values, text series, insert ranges, insert serial numbers, etc.
5. Address Bar: It shows the address of the active cell. If you have selected more than one cell, then it will show the address of the first cell in the range.
6. Formula Bar: The formula bar is an input bar, below the ribbon. It shows the content of the active cell and you can also use it to enter a formula in a cell.
7. Title Bar: The title bar will show the name of your workbook, followed by the application name (“Microsoft Excel”).
8. File Menu: The file menu is a simple menu like all other applications. It contains options like (Save, Save As, Open, New, Print, Excel Options, Share, etc).
9. Quick Access Toolbar: A toolbar to quickly access the options which you frequently use. You can add your favorite options by adding new options to quick access toolbar.
10. Ribbon Tab: Starting from the Microsoft Excel 2007, all the options menus are replaced with the ribbons. Ribbon tabs are the bunch of specific option group which further contains the option.
11. Worksheet Tab: This tab shows all the worksheets which are present in the workbook. By default you will see, three worksheets in your new workbook with the name of Sheet1, Sheet2, Sheet3 respectively.
12. Status Bar: It is a thin bar at the bottom of the Excel window. It will give you an instant help once you start working in Excel.

Microsoft Excel Basic Functions

How To Use Excel:

A Beginner’s Guide To Getting Started


Excel is a powerful application—but it can also be very intimidating.

That’s why we’ve put together this beginner’s guide to getting started with Excel.

It will take you from the very beginning (opening a spreadsheet), through entering and working with data, and finish with saving and sharing.

It’s everything you need to know to get started with Excel.


Opening a spreadsheet


When you first open Excel (by double-clicking the icon or selecting it from the Start menu), the application will ask what you want to do.


excel-open

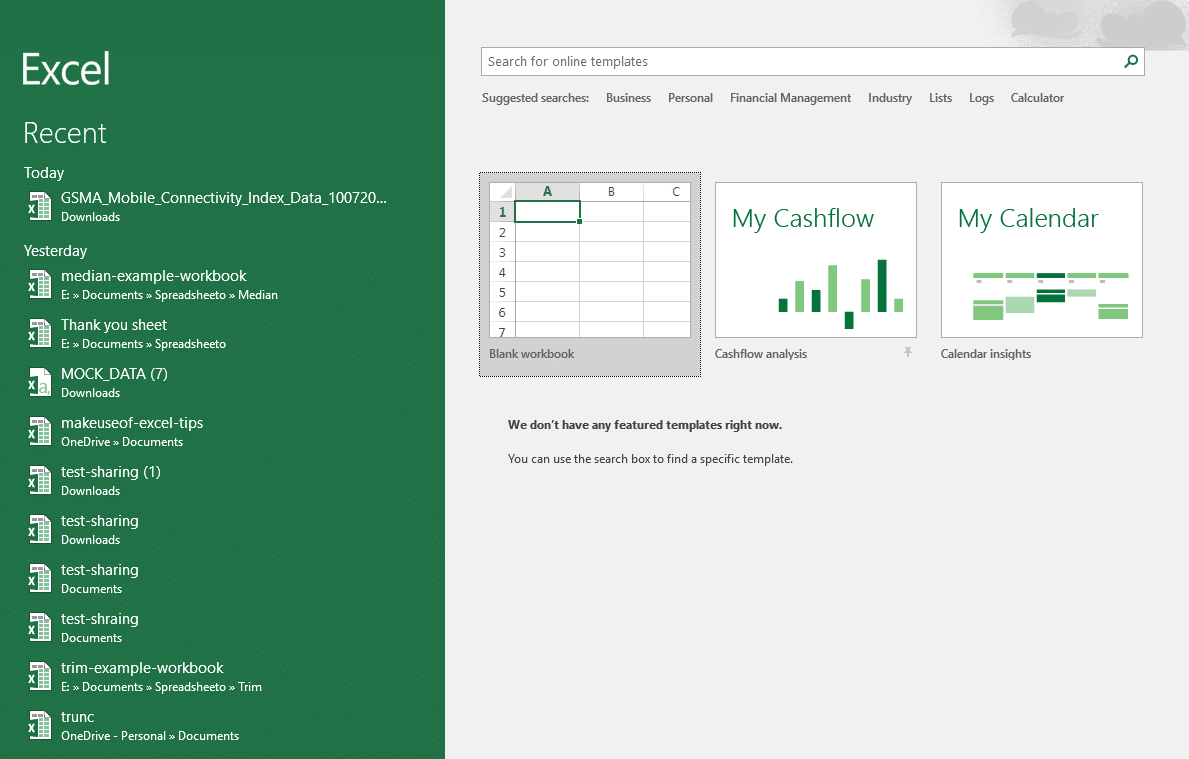
If you want to open a new spreadsheet, click Blank workbook.
To open an existing spreadsheet (like the example workbook you just downloaded), click Open Other Workbooks in the lower-left corner, then click Browse on the left side of the resulting window.
excel-open
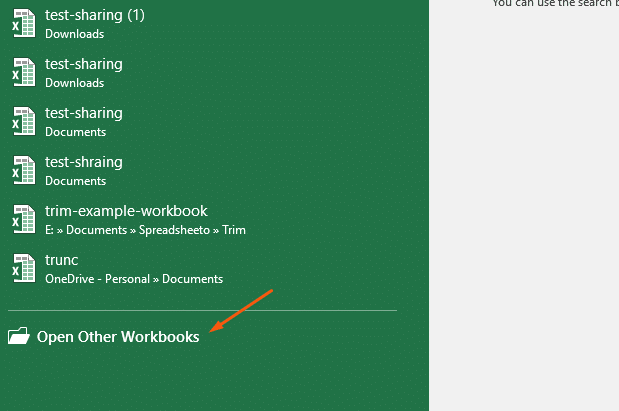
Then use the file explorer to find the workbook you’re looking for, select it, and click Open.

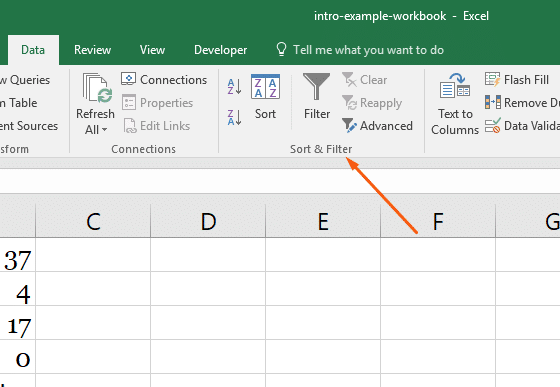
Working with the Ribbon


The Ribbon is the central control panel of Excel. You can do just about everything you need to directly from the Ribbon.

Where is this powerful tool? At the top of the window:

ribbon

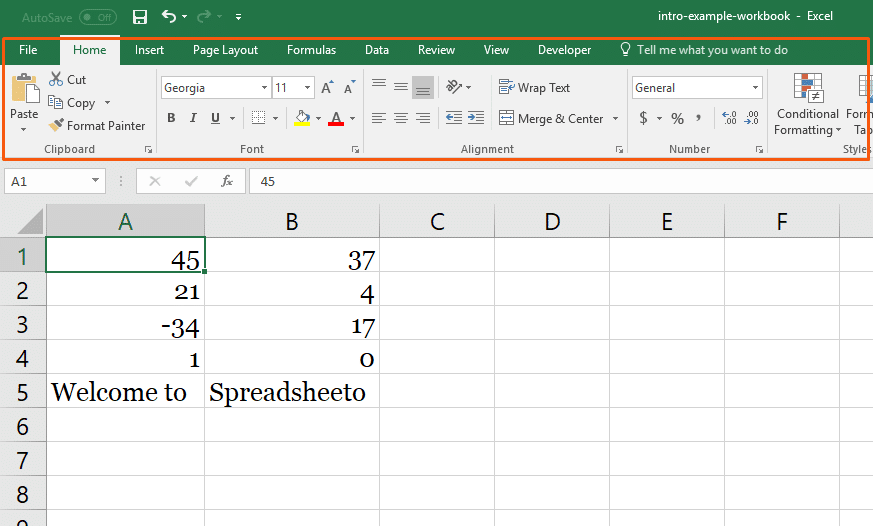
There are a number of tabs, including HomeInsertDataReview, and a few others. Each tab contains different buttons.

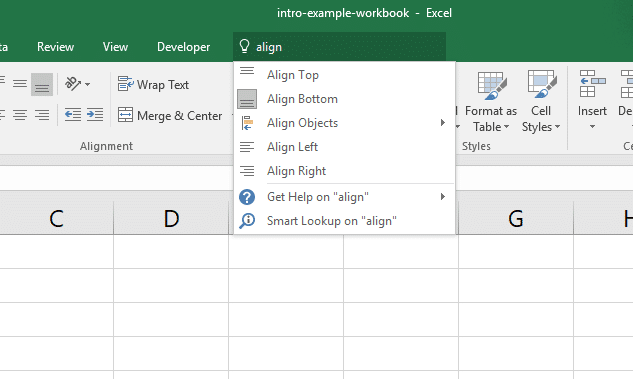
There’s also a very useful search bar in the Ribbon. It says Tell me what you want to do. Just type in what you’re looking for, and Excel will help you find it.

ribbon-search

Most of the time, you’ll be in the Home tab of the Ribbon. But Formulas and Data are also very useful (we’ll be talking about formulas shortly).

ribbon-section

Managing your sheets


As we saw, workbooks can contain multiple sheets.
You can manage those sheets with the sheet tabs near the bottom of the screen. Click a tab to open that particular worksheet.
If you’re using our example workbook, you’ll see two sheets, called Welcome and Thank You:
sheet-tabs
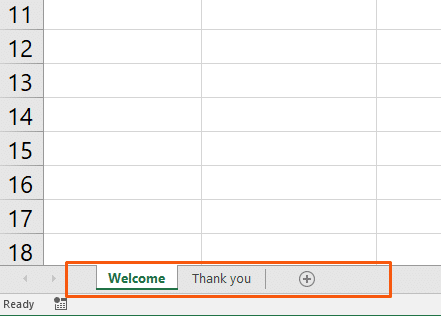
To add a new worksheet, click the + (plus) button at the end of the list of sheets.
You can also reorder the sheets in your workbook by dragging them to a new location.
And if you right-click a worksheet tab, you’ll get a number of options:
sheet-tab-options


For now, don’t worry too much about these options. Rename and Delete are useful, but the rest needn’t concern you.

Entering data

Now it’s time to enter some data!
And while entering data is one of the most central and important things you can do in Excel, it’s almost effortless.
Just click into a blank cell and start typing.


Go ahead, try it! Type your name, birthday, and your favorite number into some blank cells.


You can also copy (Ctrl + C), cut (Ctrl + X), and paste (Ctrl + V) any data you’d like (or read our full guide on copying and pasting here).
Try copying and pasting the data from the example spreadsheet into another column.
copy-paste
You can also copy data from other programs into Excel.
Try copying this list of numbers and pasting it into your sheet:
  • 17
  • 24
  • 9
  • 00
  • 3
  • 12


That’s all we’re going to cover for basic data entry. Just know that there are lots of other ways to get data into your spreadsheets if you need them.

Basic calculations

Now that we’ve seen how to get some basic data into our spreadsheet, we’re going to do some things with it.
Running basic calculations in Excel is easy. First, we’ll look at how to add two numbers.
Important: start calculations with = (equals)
When you’re running a calculation (or a formula, which we’ll discuss next), the first thing you need to type is an equals sign. This tells Excel to get ready to run some sort of calculation.
So when you see something like =MEDIAN(A2:A51), make sure you type it exactly as it is—including the equals sign.
Let’s add 3 and 4. Type the following formula in a blank cell:
=3+4
Then hit Enter.
addition
When you hit Enter, Excel evaluates your equation and displays the result, 7.
But if you look above at the formula bar, you’ll still see the original formula.
That’s a useful thing to keep in mind, in case you forget what you typed originally.


You can also edit a cell in the formula bar. Click on any cell, then click into the formula bar and start typing.


Performing subtraction, multiplication, and division is just as easy. Try these formulas:
  • =4-6
  • =2*5
  • =-10/3


What we’re going to cover next is one of the most important things in Excel. We’re giving it a very basic overview here, but feel free to read our post on cell references to get the details.


Now let’s try something different. Open up the first sheet in the example workbook, click into cell C1, and type the following:
=A1+B1
Hit Enter.
You should get 82, the sum of the numbers in cells A1 and B1.
Now, change one of the numbers in A1 or B1 and watch what happens:
auto-update
Because you’re adding A1 and B1, Excel automatically updates the total when you change the values in one of those cells.
Try doing different types of arithmetic on the other numbers in columns A and B using this method.

Unlocking the power of functions

Excel’s greatest power lies in functions. These let you run complex calculations with a few keypresses.


We’ll barely scratch the surface of functions here. Check out our other blog posts to see some of the great things you can do with functions!


Many formulas take sets of numbers and give you information about them.
For example, the AVERAGE function gives you the average of a set of numbers. Let’s try using it.
Click into an empty cell and type the following formula:
=AVERAGE(A1:A4)
Then hit Enter.
average-function
The resulting number, 0.25, is the average of the numbers in cells A1, A2, A3, and A4.
Cell range notation
In the formula above, we used “A1:A4” to tell Excel to look at all the cells between A1 and A4, including both of those cells. You can read it as “A1 through A4.”
You can also use this to include numbers in different columns. “A5:C7” includes A5, A6, A7, B5, B6, B7, C5, C6, and C7.
There are also functions that work on text.
Let’s try the CONCATENATE function!
Click into cell C5 and type this formula:
=CONCATENATE(A5, ” “, B5)
Then hit Enter.
You’ll see the message “Welcome to Spreadsheeto” in the cell.
How did this happen? CONCATENATE takes cells with text in them and puts them together.
We put the contents of A5 and B5 together. But because we also needed a space between “to” and “Spreadsheeto,” we included a third argument: the space between two quotes.


Remember that you can mix cell references (like “A5″) and typed values (like ” “) in formulas.


Excel has dozens of useful functions. To find the function that will solve a particular problem, head to the Formulas tab and click on one of the icons:
formulas-tab
Scroll through the list of available functions, and select the one you want (you may have to look around for a while).
Then Excel will help you get the right numbers in the right places:
function-arguments
If you start typing a formula, starting with the equals sign, Excel will help you by showing you some possible functions that you might be looking for:
recommend-functions
And finally, once you’ve typed the name of a formula and the opening parenthesis, Excel will tell you which arguments need to go where:
argument-reminder
If you’ve never used a function before, it might be difficult to interpret Excel’s reminders. But once you get more experience, it’ll become clear.


This is a tiny preview of how functions work and what they can do. It should be enough to get you going on the tasks you need to accomplish right away.

Saving and sharing your work

After you’ve done a bunch of work with your spreadsheet, you’re going to want to save your changes.
Hit Ctrl + S to save. If you haven’t yet saved your spreadsheet, you’ll be asked where you want to save it and what you want to call it.
You can also click the Save button in the Quick Access Toolbar:
save-qat


It’s a good idea to get into the habit of saving often. Trying to recover unsaved changes is a pain!


The easiest way to share your spreadsheets is via OneDrive.
Click the Share button in the top-right corner of the window, and Excel will walk you through sharing your document.
share-cloud
You can also save your document and email it, or use any other cloud service to share it with others.


References: 
https://excelchamps.com/blog/learn-basic-excel/amp/
https://spreadsheet.com/how-to- use-excel
https://www.cogniview.com
https://www.computerhope.come/jargon/e/excel.html.excel/microsoft-excels-history-from-1982-until-today/

Sunday 23 February 2020


Image result for coronavirus disease 2019 image

COVID-19

Coronavirus Disease 2019 (COVID-19), formerly known as 2019 Novel Coronavirus. This is a rapidly evolving situation. 

Q. What is COVID-19?
A. COVID-19 is a new virus that causes respiratory illness in people and can spread from person to person. The COVID-19 outbreak began in December 2019 and Chinese health officials have reported thousands of COVID-19 infections in China, including some that resulted in death.
Other countries, including the United States, have also reported cases of COVID-19 infection. For the latest developments, including current case counts.

Q: Why is the disease causing the outbreak now being called coronavirus disease 2019, COVID-19?
A: On February 11, 2020 the World Health Organization announced an official name for the disease that is causing the 2019 novel coronavirus outbreak, first identified in Wuhan China. The new name of this disease is coronavirus disease 2019, abbreviated as COVID-19. In COVID-19, ‘CO’ stands for ‘corona,’ ‘VI’ for ‘virus,’ and ‘D’ for disease. Formerly, this disease was referred to as “2019 novel coronavirus” or “2019-nCoV.”
There are many types of human coronaviruses including some that commonly cause mild upper-respiratory tract illnesses. COVID-19 is a new disease, caused be a novel (or new) coronavirus that has not previously been seen in humans. The name of this disease was selected following the World Health Organization (WHO) best practiceexternal icon for naming of new human nfectious diseases.
Q: What is the name of the virus causing the outbreak of coronavirus disease starting in 2019?
A: On February 11, 2020, the International Committee on Taxonomy of Viruses, charged with naming new viruses, named the novel coronavirus, first identified in Wuhan, China, severe acute respiratory syndrome coronavirus 2, shortened to SARS-CoV-2.
As the name indicates, the virus is related to the SARS-associated coronavirus (SARS-CoV) that caused an outbreak of severe acute respiratory syndrome (SARS) in 2002-2003, however it is not the same virus.
Q: What is the source of the virus?
A: Public health officials and partners are working hard to identify the original animal source of the virus that causes COVID-19. Coronaviruses are a large family of viruses, some causing illness in people and others that circulate among animals, including camels, cats and bats. Analysis of the genetic tree of this virus indicates it originated in bats, but whether the virus jumped directly from bats or whether there was an intermediary animal host is not, yet, known. SARS-CoV, another bat-origin coronavirus jumped to infect people via civets, while MERS-CoV, another bat-origin coronavirus jumped to people via camels. More information about the source and spread of this novel coronavirus available on the COVID-19 Situation Summary: Source and Spread of the Virus.
Q: How does the virus spread?
A: The new coronavirus seems to be spreading from person-to-person. Learn what is known about the spread of COVID-19.
Current understanding about how the virus that causes coronavirus disease 2019 (COVID-19) spreads is largely based on what is known about similar coronaviruses.

Person-to-person spread

The virus is thought to spread mainly from person-to-person.
  • Between people who are in close contact with one another (within about 6 feet)
  • Via respiratory droplets produced when an infected person coughs or sneezes.
  • These droplets can land in the mouths or noses of people who are nearby or possibly be inhaled into the lungs.

Spread from contact with infected surfaces or objects

It may be possible that a person can get COVID-19 by touching a surface or object that has the virus on it and then touching their own mouth, nose, or possibly their eyes, but this is not thought to be the main way the virus spreads.

When does spread happen?

  • People are thought to be most contagious when they are most symptomatic (the sickest).
  • Some spread might be possible before people show symptoms; there have been reports of this with this new coronavirus, but this is not thought to be the main way the virus spreads.

How efficiently does the virus spread?

How easily a virus spreads from person-to-person can vary. Some viruses are highly contagious (like measles), while other viruses are less so. Another factor is whether the spread continues over multiple generations of people (if spread is sustained). The virus that causes COVID-19 seems to be spreading easily and sustainably in Hubei province and other parts of China. In the United States, spread from person-to-person has occurred only among a few close contacts and has not spread any further to date.

There is still more to be learned

COVID-19 is an emerging disease and there is more to learn about its transmissibility, severity, and other features and what will happen in the United States. New information will further inform the risk assessment.

Q: Can someone who has had COVID-19 spread the illness to others?
A: The virus that causes COVID-19 is spreading from person-to-person. Someone who is actively sick with COVID-19 can spread the illness to others. That is why CDC recommends that these patients be isolated either in the hospital or at home (depending on how sick they are) until they are better and no longer pose a risk of infecting others.
How long someone is actively sick can vary so the decision on when to release someone from isolation is made on a case-by-case basis in consultation with doctors, infection prevention and control experts, and public health officials and involves considering specifics of each situation including disease severity, illness signs and symptoms, and results of laboratory testing for that patient.
Current CDC guidance for when it is OK to release someone from isolation is made on a case by case basis and includes meeting all of the following requirements:
  • The patient is free from fever without the use of fever-reducing medications.
  • The patient is no longer showing symptoms, including cough.
  • The patient has tested negative on at least two consecutive respiratory specimens collected at least 24 hours apart.
Someone who has been released from isolation is not considered to pose a risk of infection to others.
Q: Can someone who has been quarantined for COVID-19 spread the illness to others?
A: Quarantine means separating a person or group of people who have been exposed to a contagious disease but have not developed illness (symptoms) from others who have not been exposed, in order to prevent the possible spread of that disease. Quarantine is usually established for the incubation period of the communicable disease, which is the span of time during which people have developed illness after exposure. For COVID-19, the period of quarantine is 14 days from the last date of exposure, because 14 days is the longest incubation period seen for similar coronaviruses. Someone who has been released from COVID-19 quarantine is not considered a risk for spreading the virus to others because they have not developed illness during the incubation period.
Q: Is SARS-CoV-2 (the virus causing COVID-19) the same as the MERS-CoV or SARS-CoV?
A: No. Coronaviruses are a large family of viruses, some causing illness in people and others that circulate among animals, including camels, cats, and bats. The recently emerged SARS-CoV-2 is not the same as the coronavirus that causes Middle East Respiratory Syndrome (MERS) or Severe Acute Respiratory Syndrome (SARS). Genetic analyses indicates that SARS-CoV-2 is related to the SARS-CoV associated with an outbreak of respiratory illness among people in 2002-2003.

Prevention

Q: How can I help protect myself?
A: Visit the COVID-19 Prevention and Treatment page to learn about how to protect yourself from respiratory illnesses, like COVID-19.
Q: What should I do if I had close contact with someone who has COVID-19?
A: There is information for people who have had close contact with a person confirmed to have, or being evaluated for, COVID-19 available online.
Q: Does CDC recommend the use of facemask in the community to prevent COVID-19?
A: CDC does not recommend that people who are well wear a facemask to protect themselves from respiratory illnesses, including COVID-19. You should only wear a mask if a healthcare professional recommends it. A facemask should be used by people who have COVID-19 and are showing symptoms. This is to protect others from the risk of getting infected. The use of facemasks also is crucial for health workers and other people who are taking care of someone infected with COVID-19 in close settings (at home or in a health care facility).

The World Health Organization (WHO) and Centers for Disease Control (CDC) advise international travelers to practice these usual health precautions:
  • Avoid close contact with people suffering from acute respiratory infections
  • Avoid visiting healthcare facilities in a country with cases of COVID-19
  • Practice frequent hand washing especially after direct contact with ill people or their environment
  • Avoid close contact with live or dead farm or wild animals. Touching poultry/birds or their droppings should be avoided, as well as visiting live poultry markets or farms
  • Travelers with symptoms of acute respiratory infection should practice cough etiquette (maintain distance, cover your mouth when you cough and sneeze with disposable tissue or clothing. Wear surgical masks to minimize airborne transmission of infection)
Immediately seek medical attention in case of symptoms suggestive of respiratory illness during or within 14 days after travel.
P

Medical Information

Q: What are the symptoms and complications that COVID-19 can cause?
A: Current symptoms reported for patients with COVID-19 have included mild to severe respiratory illness with fever1, cough, and difficulty breathing. Read about COVID-19 Symptoms.
For confirmed coronavirus disease 2019 (COVID-19) cases, reported illnesses have ranged from mild symptoms to severe illness and death. Symptoms can include:
  • Fever
  • Cough
  • Shortness of breath
CDC believes at this time that symptoms of COVID-19 may appear in as few as 2 days or as long as 14 days after exposure. This is based on what has been seen previously as the incubation period of MERS-CoV viruses.

Q: Should I be tested for COVID-19?
A: If you develop a fever1 and symptoms of respiratory illness, such as cough or shortness of breath, within 14 days after travel from China, you should call ahead to a healthcare professional and mention your recent travel or close contact. If you have had close contact2 with someone showing these symptoms who has recently traveled from this area, you should call ahead to a healthcare professional and mention your close contact and their recent travel. Your healthcare professional will work with your state’s public health department and CDC to determine if you need to be tested for COVID-19.
Q: How do you test a person for COVID-19?
A: At this time, diagnostic testing for COVID-19 can be conducted only at CDC.
State and local health departments who have identified a person under investigation (PUI) should immediately notify CDC’s Emergency Operations Center (EOC) to report the PUI and determine whether testing for COVID-19 at CDC is indicated. The EOC will assist local/state health departments to collect, store, and ship specimens appropriately to CDC, including during afterhours or on weekends/holidays.
For more information on specimen collection see CDC Information for Laboratories.
Q: Can a person test negative and later test positive for COVID-19?
A: Using the CDC-developed diagnostic test, a negative result means that the virus that causes COVID-19 was not found in the person’s sample. In the early stages of infection, it is possible the virus will not be detected.
For COVID-19, a negative test result for a sample collected while a person has symptoms likely means that the COVID-19 virus is not causing their current illness.
Q: What should healthcare professionals and health departments do?
A: For recommendations and guidance on persons under investigation; infection control, including personal protective equipment guidance; home care and isolation; and case investigation, see Information for Healthcare Professionals. For information on specimen collection and shipment, see Information for Laboratories. For information for public health professional on COVID-19, see Information for Public Health Professionals.


Is the outbreak a pandemic?


A pandemic, in WHO terms, is “the worldwide spread of a disease”. Coronavirus cases have been confirmed outside China, but by no means in all 195 countries on the WHO’s list. It is also not spreading within those countries at the moment, except in a very few cases. By far the majority of cases are travellers who picked up the virus in China.

Should we panic?

No. The spread of the virus outside China is worrying but not an unexpected development. The WHO has declared the outbreak to be a public health emergency of international concern. The key issues are how transmissible this new coronavirus is between people, and what proportion become severely ill and end up in hospital. Often viruses that spread easily tend to have a milder impact. Generally, the coronavirus appears to be hitting older people hardest, with few cases in children.

Update as of 02/18/2020:  Over 73,000
confirmed cases of the coronavirus disease
(COVID-19) have been reported globally. A 
novel coronavirus was reported
by authorities in Wuhan, Chinalast December 
2019. The coronavirus disease or 
COVID-19, is a new strain that has notbeen previously seen in humans. As of 
February 18, 2020, a total of 73,332 cases have 
been infected from different 
parts of the world, with a majority of this 
number coming from China.


Last updated: February 23, 2020, 07:15 GMT

Coronavirus Cases


There are currently 78,777 confirmed cases and 2,462 deaths from the coronavirus COVID-19 outbreak as of February 23, 2020, 07:15 GMT.
For a detailed view see: cases by country and territory.
Graphs on this page:
Currently Infected
53,057
Mild Condition
41,504
(78%)
Serious or Critical
11,553
(22%)
Cases with Outcome
25,720
Recovered/Discharged
23,258
(90%)
Deaths
2,462
(10%)
The charts below show daily and total case trends. Data is added, and charts updated, after the close of the day (GMT+0).

Total Cases (worldwide)


"Total Cases" = total cumulative count (78,777). This figure therefore includes deaths and recovered or discharged patients (cases with an outcome).

Total Coronavirus CasesTotal Cases(Linear Scale)Jan 22Jan 24Jan 26Jan 28Jan 30Feb 01Feb 03Feb 05Feb 07Feb 09Feb 11Feb 13Feb 15Feb 17Feb 19Feb 210100k25k50k75kCases
Source: Worldometer - www.worldometers.info Worldometer


Daily Cases (worldwide)

The spike observed on Feb. 12 is the result, for the most part, of a change in diagnosis classification for which 13,332 clinically (rather than laboratory) confirmed cases were all reported as new cases on Feb. 12, even though they were diagnosed in the preceding days and weeks. We will distribute these cases over the correct period once the analysis being conducted by the WHO with China's NHC is completed. See also: How to interpret the 15,152 (+600%) surge in new cases of February 12
Novel Coronavirus Daily CasesDaily New CasesCases per DayData as of 0:00 GMT+0Jan 23Jan 25Jan 27Jan 29Jan 31Feb 02Feb 04Feb 06Feb 08Feb 10Feb 12Feb 14Feb 16Feb 18Feb 20Feb 22Jan 24Jan 26Jan 28Jan 30Feb 01Feb 03Feb 05Feb 07Feb 09Feb 11Feb 13Feb 15Feb 17Feb 19Feb 2105k10k15kDaily Cases
Source: Worldometer - www.worldometers.info Worldometer


Growth Factor of Daily New Cases


Growth factor is the factor by which a quantity multiplies itself over time. The formula used is every day's new cases new cases on the previous day. For example, a quantity growing by 7% every period (in this case daily) has a growth factor of 1.07.

A growth factor above 1 indicates an increase, whereas one which remains between 0 and 1 it is a sign of decline, with the quantity eventually becoming zero, whereas a growth factor constantly above 1 could signal exponential growth
Daily Cases Growth FactorGrowth FactorDaily Cases Growth FactorJan 24Jan 26Jan 28Jan 30Feb 01Feb 03Feb 05Feb 07Feb 09Feb 11Feb 13Feb 15Feb 17Feb 19Feb 21Jan 25Jan 27Jan 29Jan 31Feb 02Feb 04Feb 06Feb 08Feb 10Feb 12Feb 14Feb 16Feb 18Feb 20Feb 22024681357Daily Cases Growth Factor
Source: Worldometer - www.worldometers.info Worldometer

Total Cases excluding mainland China

Total Coronavirus CasesTotal Cases outside of China(Linear Scale)Jan 22Jan 24Jan 26Jan 28Jan 30Feb 01Feb 03Feb 05Feb 07Feb 09Feb 11Feb 13Feb 15Feb 17Feb 19Feb 210500100015002000Cases
Source: Worldometer - www.worldometers.info Worldometer

Daily Cases excluding mainland China

Coronavirus Daily Cases outside ofChinaDaily New Cases outside of ChinaCases per DayData as of 0:00 GMT+0Jan 23Jan 25Jan 27Jan 29Jan 31Feb 02Feb 04Feb 06Feb 08Feb 10Feb 12Feb 14Feb 16Feb 18Feb 20Feb 220100200300400Daily Cases
Source: Worldometer - www.worldometers.info Worldometer

Growth Factor excluding mainland China

Daily Cases Growth Factor outside ofChinaGrowth Factor outside of ChinaDaily Cases Growth FactorJan 24Jan 30Feb 05Feb 11Feb 17Jan 27Feb 02Feb 08Feb 14Feb 20Jan 25Jan 26Jan 28Jan 29Jan 31Feb 01Feb 03Feb 04Feb 06Feb 07Feb 09Feb 10Feb 12Feb 13Feb 15Feb 16Feb 18Feb 19Feb 21Feb 220102.557.5Daily Cases Growth Factor outside of China
Source: Worldometer - www.worldometers.info Worldometer

Active Cases

By removing deaths and recoveries from total cases, we get "currently infected cases" or "active cases" (cases still awaiting for an outcome).
Total Coronavirus Currently InfectedActive Cases(Number of Infected People)Jan 22Jan 24Jan 26Jan 28Jan 30Feb 01Feb 03Feb 05Feb 07Feb 09Feb 11Feb 13Feb 15Feb 17Feb 19Feb 21020k40k60k80kCurrently Infected
Source: Worldometer - www.worldometers.info Worldometer

Cases

Distribution of cases worldwideChina (mainland): 97.67% (76,938 cases)China (mainland): 97.67% (76,938 cases)Other Countries: 2.33 %(1,839 cases)Other Countries: 2.33 %(1,839 cases)
Source: Worldometer - www.worldometers.info Worldometer

Outside of China

Distribution of cases outside of mainland ChinaDiamond Princess: 34.49% (634 cases)Diamond Princess: 34.49% (634 cases)South Korea: 30.24 % (556 cases)South Korea: 30.24 % (556 cases)Japan: 7.34 % (135 cases)Japan: 7.34 % (135 cases)Singapore: 4.84 % (89 cases)Singapore: 4.84 % (89 cases)Italy: 4.30 % (79 cases)Italy: 4.30 % (79 cases)Hong Kong: 3.81 % (70 cases)Hong Kong: 3.81 % (70 cases)United States: 1.90 % (35 cases)United States: 1.90 % (35 cases)Thailand: 1.90 % (35 cases)Thailand: 1.90 % (35 cases)Iran: 1.58 % (29 cases)Iran: 1.58 % (29 cases)Taiwan: 1.52 % (28 cases)Taiwan: 1.52 % (28 cases)Malaysia: 1.20 % (22 cases)Malaysia: 1.20 % (22 cases)
Source: Worldometer - www.worldometers.info Worldometer

Recovered and Discharged

Total Coronavirus CuredTotal Cured(Linear Scale)Feb 02Feb 03Feb 04Feb 05Feb 06Feb 07Feb 08Feb 09Feb 10Feb 11Feb 12Feb 13Feb 14Feb 15Feb 16Feb 17Feb 18Feb 19Feb 20Feb 21Feb 2205k10k15k20k25kCuredFeb 21 Cured: 20,895
Source: Worldometer - www.worldometers.info Worldometer

Newly Infected vs. Newly Recovered

New Daily Coronavirus Cases+CuredNew Cases vs. New Recoveries(Number of newly infected vs.
number of recovered and discharged patients each day)Jan 23Jan 25Jan 27Jan 29Jan 31Feb 02Feb 04Feb 06Feb 
08Feb 10Feb 12Feb 14Feb 16Feb 18Feb 20Feb 22Jan 24Jan 26Jan 28Jan 30Feb 01Feb 03Feb 05Feb 07Feb 09Feb 11Feb
13Feb 15Feb 17Feb 19Feb 2105k10k15kNew RecoveriesNew CasesFeb 20 New Cases: 977
(idea by Rudi Roth)
Source: Worldometer - www.worldometers.info Worldometer

Serious and Critical Cases

Total Serious and Critical CasesTotal Serious and Critical Cases(Linear Scale)Feb 02Feb 04Feb 06Feb 08Feb 10Feb 12Feb 14Feb 16Feb 18Feb 20Feb 22Feb 03Feb 05Feb 07Feb 09Feb 11Feb 13Feb 15Feb 17Feb 19Feb 2102.5k5k7.5k10k12.5k15kSerious and Critical Cases
Source: Worldometer - www.worldometers.info Worldometer

Outcome of Cases (Recovery or Death)

Percent (%)Outcome of total closed cases (recovery rate vs death rate)(Cumulative total deaths and recoveries over cumulative number of closed cases)Feb 02Feb 03Feb 04Feb 05Feb 06Feb 07Feb 08Feb 09Feb 10Feb 11Feb 12Feb 13Feb 14Feb 15Feb 16Feb 17Feb 18Feb 19Feb 20Feb 21Feb 220100255075Death RateRecovery Rate
Source: Worldometer - www.worldometers.info Worldometer

New Cases in China outside Hubei

New Cases in China excluding HubeiprovinceNew cases in China outside of Hubei (Covid-19)New confirmed cases per DayJan 23Jan 25Jan 27Jan 29Jan 31Feb 02Feb 04Feb 06Feb 08Feb 10Feb 12Feb 14Feb 16Feb 18Feb 20Feb 2201000250500750New Cases in China outside of Hubei
Source: Worldometer - www.worldometers.info Worldometer
Reference:
https://www.worldometers.info/coronavirus/coronavirus-cases/
https://www.cdc.gov/coronavirus/2019-ncov/faq.html
https://www.unilab.com.ph/articles/coronavirus-overview-symptoms-prevention/


INSTRUCTIONAL TOOL: EXCEL FOR NURSES

Introduction to Microsoft Excel What is Excel? Excel is a software program from  Microsoft  that is part of the Microsoft Off...